| Smooth Dogfish Summary Data |
|
|
|
|
|
|
|
|
|
|
|
|
|
|
|
|
|
|
| The
data presented in this file were last updated in |
May 2023. |
|
| Abundance
indices are presented through the Fall 2022 cruise. |
|
|
| General
Information |
|
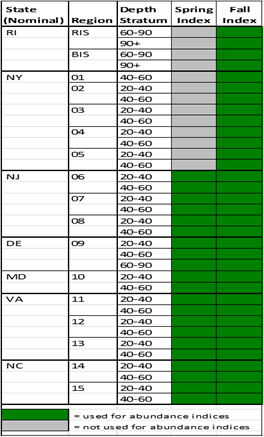
Index Strata |
|
|
|
|
|
|
|
|
|
|
|
|
|
|
|
|
|
|
|
|
|
|
|
|
|
|
|
|
|
|
|
|
|
|
|
|
|
|
|
|
|
|
|
|
|
|
|
|
|
|
|
|
|
|
|
|
|
|
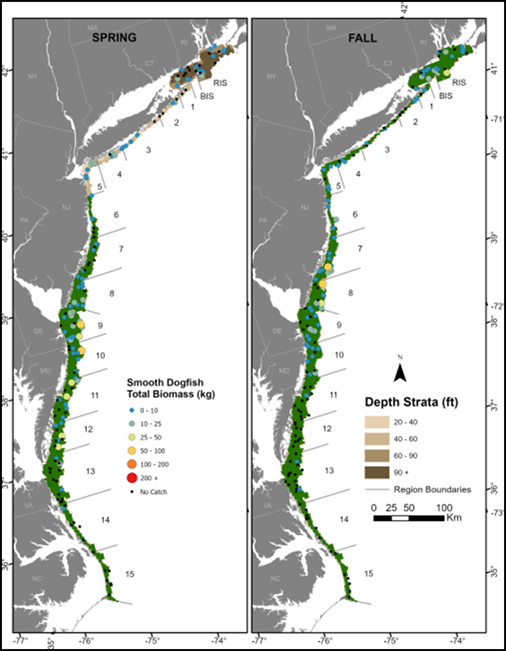
| Catch
Distribution - 2022 |
|
|
|
|
| Catch
and Sampling History |
|
|
|
Season |
Year |
Number Caught |
Biomass Caught
(kg) |
Presence at
Index Stations (%) |
Number Measured |
Age Specimens |
Ages Read |
Stomach
Specimens |
Stomachs
Analyzed |
|
|
Spring |
2008 |
927 |
2,490.9 |
96.1 |
688 |
297 |
0 |
288 |
286 |
|
|
|
2009 |
947 |
2,746.4 |
82.4 |
725 |
236 |
0 |
221 |
216 |
|
|
|
2010 |
402 |
1,232.6 |
76.5 |
399 |
188 |
0 |
181 |
174 |
|
|
|
2011 |
521 |
1,741.5 |
61.8 |
458 |
186 |
0 |
173 |
171 |
|
|
|
2012 |
189 |
627.3 |
50.0 |
189 |
138 |
0 |
132 |
123 |
|
|
|
2013 |
411 |
1,236.1 |
65.7 |
411 |
176 |
0 |
167 |
163 |
|
|
|
2014 |
321 |
961.3 |
59.8 |
321 |
140 |
0 |
137 |
137 |
|
|
|
2015 |
292 |
948.8 |
61.8 |
292 |
178 |
0 |
174 |
173 |
|
|
|
2016 |
365 |
1,104.7 |
58.8 |
357 |
187 |
0 |
176 |
176 |
|
|
|
2017 |
856 |
1,512.3 |
13.7 |
856 |
181 |
0 |
163 |
162 |
|
|
|
2018 |
789 |
2,462.7 |
55.9 |
757 |
236 |
0 |
229 |
225 |
|
|
|
2019 |
676 |
1,828.8 |
63.7 |
656 |
251 |
0 |
241 |
241 |
|
|
|
2020 |
No
Sampling Due to COVID-19 Restrictions |
|
|
|
2021 |
354 |
1,041.8 |
34.3 |
354 |
155 |
0 |
150 |
146 |
|
|
|
2022 |
273 |
884.9 |
51.0 |
273 |
167 |
0 |
152 |
150 |
|
|
Fall |
2007 |
1,684 |
1,557.7 |
54.7 |
759 |
196 |
0 |
194 |
192 |
|
|
|
2008 |
414 |
364.8 |
48.7 |
386 |
162 |
0 |
161 |
161 |
|
|
|
2009 |
1,178 |
847.5 |
76.0 |
1,178 |
333 |
0 |
330 |
323 |
|
|
|
2010 |
758 |
690.5 |
60.7 |
602 |
223 |
0 |
215 |
215 |
|
|
|
2011 |
606 |
612.1 |
58.0 |
606 |
205 |
0 |
203 |
203 |
|
|
|
2012 |
783 |
946.2 |
43.3 |
783 |
161 |
0 |
158 |
151 |
|
|
|
2013 |
549 |
770.3 |
53.3 |
459 |
174 |
0 |
170 |
166 |
|
|
|
2014 |
490 |
560.2 |
50.0 |
432 |
165 |
0 |
157 |
157 |
|
|
|
2015 |
545 |
544.1 |
56.7 |
545 |
186 |
0 |
179 |
179 |
|
|
|
2016 |
224 |
182.6 |
36.0 |
224 |
109 |
0 |
105 |
103 |
|
|
|
2017 |
286 |
598.7 |
40.7 |
286 |
149 |
0 |
146 |
146 |
|
|
|
2018 |
1,026 |
1,278.1 |
50.7 |
714 |
185 |
0 |
179 |
179 |
|
|
|
2019 |
343 |
377.2 |
36.7 |
343 |
118 |
0 |
112 |
110 |
|
|
|
2020 |
387 |
545.6 |
50.7 |
387 |
159 |
0 |
152 |
152 |
|
|
|
2021 |
339 |
737.4 |
48.7 |
339 |
169 |
0 |
159 |
156 |
|
|
|
2022 |
405 |
623.5 |
48.7 |
405 |
170 |
0 |
158 |
70 |
|
|
|
|
|
|
|
|
|
|
|
|
|
|
|
|
|
|
|
|
|
|
|
|